George K Paul
B. Tech (Mechanical)
M Des VC (1999-01)
IDC, IIT Bombay


Visual
Display of Dyanamic
Information
Guide:
Prof: Kirti
Trivedi
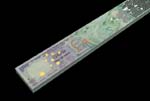
This project aims at designing and visualizing large and complex dynamic
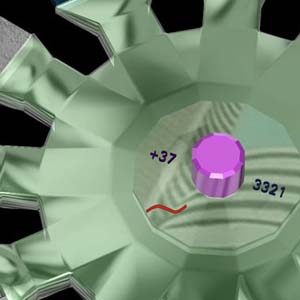
data systems for effective communication and analysis. The stocnova, a
star shaped virtual organism is an experimental three dimensional visualization
of the stock exchange which allows the user to see the changes in the
market in real time. The stocnova responds to changes in the market by
changing its appearance. Information is structured in three levels, market,
sector and stock. The market index, sector indices, price and traded volume
of stocks etc can be seen on the stocnova. The user can switch between
different levels of information and easily access the data required.
Next Information Design Project